


- Revenue Cycle Management
- COVID-19
- Reimbursement
- Diabetes Awareness Month
- Risk Management
- Patient Retention
- Staffing
- Medical Economics® 100th Anniversary
- Coding and documentation
- Business of Endocrinology
- Telehealth
- Physicians Financial News
- Cybersecurity
- Cardiovascular Clinical Consult
- Locum Tenens, brought to you by LocumLife®
- Weight Management
- Business of Women's Health
- Practice Efficiency
- Finance and Wealth
- EHRs
- Remote Patient Monitoring
- Sponsored Webinars
- Medical Technology
- Billing and collections
- Acute Pain Management
- Exclusive Content
- Value-based Care
- Business of Pediatrics
- Concierge Medicine 2.0 by Castle Connolly Private Health Partners
- Practice Growth
- Concierge Medicine
- Business of Cardiology
- Implementing the Topcon Ocular Telehealth Platform
- Malpractice
- Influenza
- Sexual Health
- Chronic Conditions
- Technology
- Legal and Policy
- Money
- Opinion
- Vaccines
- Practice Management
- Patient Relations
- Careers
Most Bizarre Economic Indicators
Investors are always looking for some new indicator to give them some idea of where the economy is going and they've looked for trends in really odd places.
Estee Lauder’s earnings report may be good news for the company — revenue up 10% and earnings per share up 23% — but those numbers don’t bode well for the country. According to one indicator, the more makeup women buy, the worse off the economy is.
As odd as the Lipstick Indicator sounds, it — and plenty of other bizarre indicators — is actually used by some investors. Some odd indicators have historical data to back them up (Unclaimed Corpse Indicator), some have believers like Alan Greenspan (Men’s Underwear Index), and other are really just myths (Hemline Index).
Business Insider
has rounded up the 36 most bizarre economic indicators that economists and investors have turned to in an attempt to develop a point of view on where the economy is expected to go.
Here are 10 of the oddest indicators that actually make sense when you think about it:
Unclaimed Corpse Indicator
Family members don’t claim bodies of the deceased so they won’t have to pay for funeral costs. As a result the state pays for the costs.
Proof: In 2009 in Detroit, where 33% of adults were unemployed at the time, state payment for burials doubled for two-month time periods compared to a year ago.
Baby Diaper Rash Indicator
Babies go through a lot of diapers and it can’t really be helped. But the idea behind this indicator is that parents are attempting to save costs by changing their babies’ and toddlers’ diapers fewer times throughout the day.
Proof: Disposable diaper sales were down 9% while diaper rash cream volume increased by 2.8%, according to Symphony IRI.
The High Heel Index

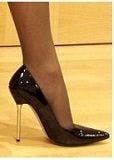
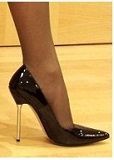
IBM’s consumer products expert, Dr. Trevor Davis suggested that since economic downturns are such bummers, consumers turn to more flamboyant fashions as a means of escape.
According to IBM, heel heights soared during the most prominent recessions in U.S. history. In the 1920s, the low heels of flappers were replaced with heels and platforms during the Great Depression and low, thick heels from the grunge era of the 1990s gave way to stilettos during the dot-com boom.
Proof:
Skinny Tie Width Indicator
There’s more than one thing in play for this indicator. First of all, tie sales will grow because men want to look like they’re working harder
— this makes perfect sense. However, style also moves with the economy. While it’s, perhaps, understandable that ties are brighter during economic recovery, it’s also true that for some reason ties get slimmer during downturns.
BI
Proof: Tie sales spiked in the U.K. when news broke of coming layoffs in 2007. However, it’s also true that ties got slimmer during bad times, but that was typically because of austerity measures during past wars. According to , current production abilities have seemingly put that indicator on hold.
The First Date Indicator
Want to feel better about yourself during a bad economy? Lonely? People seek out others for first dates during economic downturns.
According to Match.com, the fourth quarter of 2008 was its busiest period in seven years and the second busiest weekend was when the Dow fell to five-year lows in November 2008. Also, traffic spiked after the 9/11 attacks.
Proof:
Coupon Redemption Index

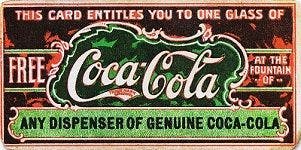
Money is probably pretty tight during an recession, so people try to save money any way they can. Unsurprisingly, this means cutting coupons.
Extreme Couponing
Proof: Coupon redemption soared to 3.3 billion uses in 2009. Plus, look at the recent rise in popularity of shows like . Worryingly, coupon use increased by 4% during the second quarter of 2012, according to coupon processing firm Inmar.
Cardboard Box Leading Indicator
When cardboard use declines, you should worry that a recession is on the horizon. If use increases, expansion is on the way.
This is actually pretty basic since most non-durable goods are shipped in cardboard containers. An increase in cardboard means companies are shipping more and employing more people. A decrease means less product and layoffs. Operating profits for Europe’s biggest producer of cardboard boxes, Smurfit Kappa, declined by 50% in 2008 compared to the year before.
Proof:
Men’s Underwear Index
Men save some money by not bothering buying new underwear with times are tough.
Research firm Mintel said men’s underwear sales fell 2.3% in 2009. This index has enough historical data to back it up that former Federal Reserve chairman Alan Greenspan believes it.
Proof:
Lipstick Indicator
Who can afford indulgences like new handbags and shoes when money is tight? Instead, women buy makeup, which is cheaper. This indicator was created by Leonard Lauder, chairman of Estee Lauder.
Proof: In the recession following Sept. 11, lipstick sales doubled, according to Investopedia.
Hot Waitress and Waiter Index
Admittedly, this one not only seems incredibly ridiculous, but a little insulting. But, according to the indicator, the hotter the waiters and waitresses, the worse the economy is doing.
New York Magazine
According to ,
when the economy is strong, those good-looking people can get better paying jobs doing things like modeling or hosting events, leaving the less attractive to stand around and wait tables. Luckily, this is a leading indicator. So if you start to notice the wait staff is not quite so good looking, that’s uplifting.
Proof:
NYMag
According to , “
As a commodity that’s fairly cheap, historically effective as a marketing tool, and available on a freelance basis, hotness will likely be back in demand long before your average Michigan autoworker is. Or the rest of us, for that matter.”
And what about that Hemline Index, the one that seems to be pure myth? The idea is that the shorter the hemline the better the economy is looking. Retail buyers say there’s nothing to back that up. However, economists think runways were filled with rather dreary lengths after the financial crisis. And here’s something to keep you thinking: this summer was filled with maxi skirts and dresses.
Read more:


