Article
First-Time 3D Retinal tPO2 Images Produced
Author(s):
This development can have future implications for patients with age-related macular degeneration.


Researchers have produced 3D images of retinal tissue oxygen tension (tPO2) for the first time, in a rat model. Although an animal trial, the development can have future implications for patients with age-related macular degeneration (AMD).
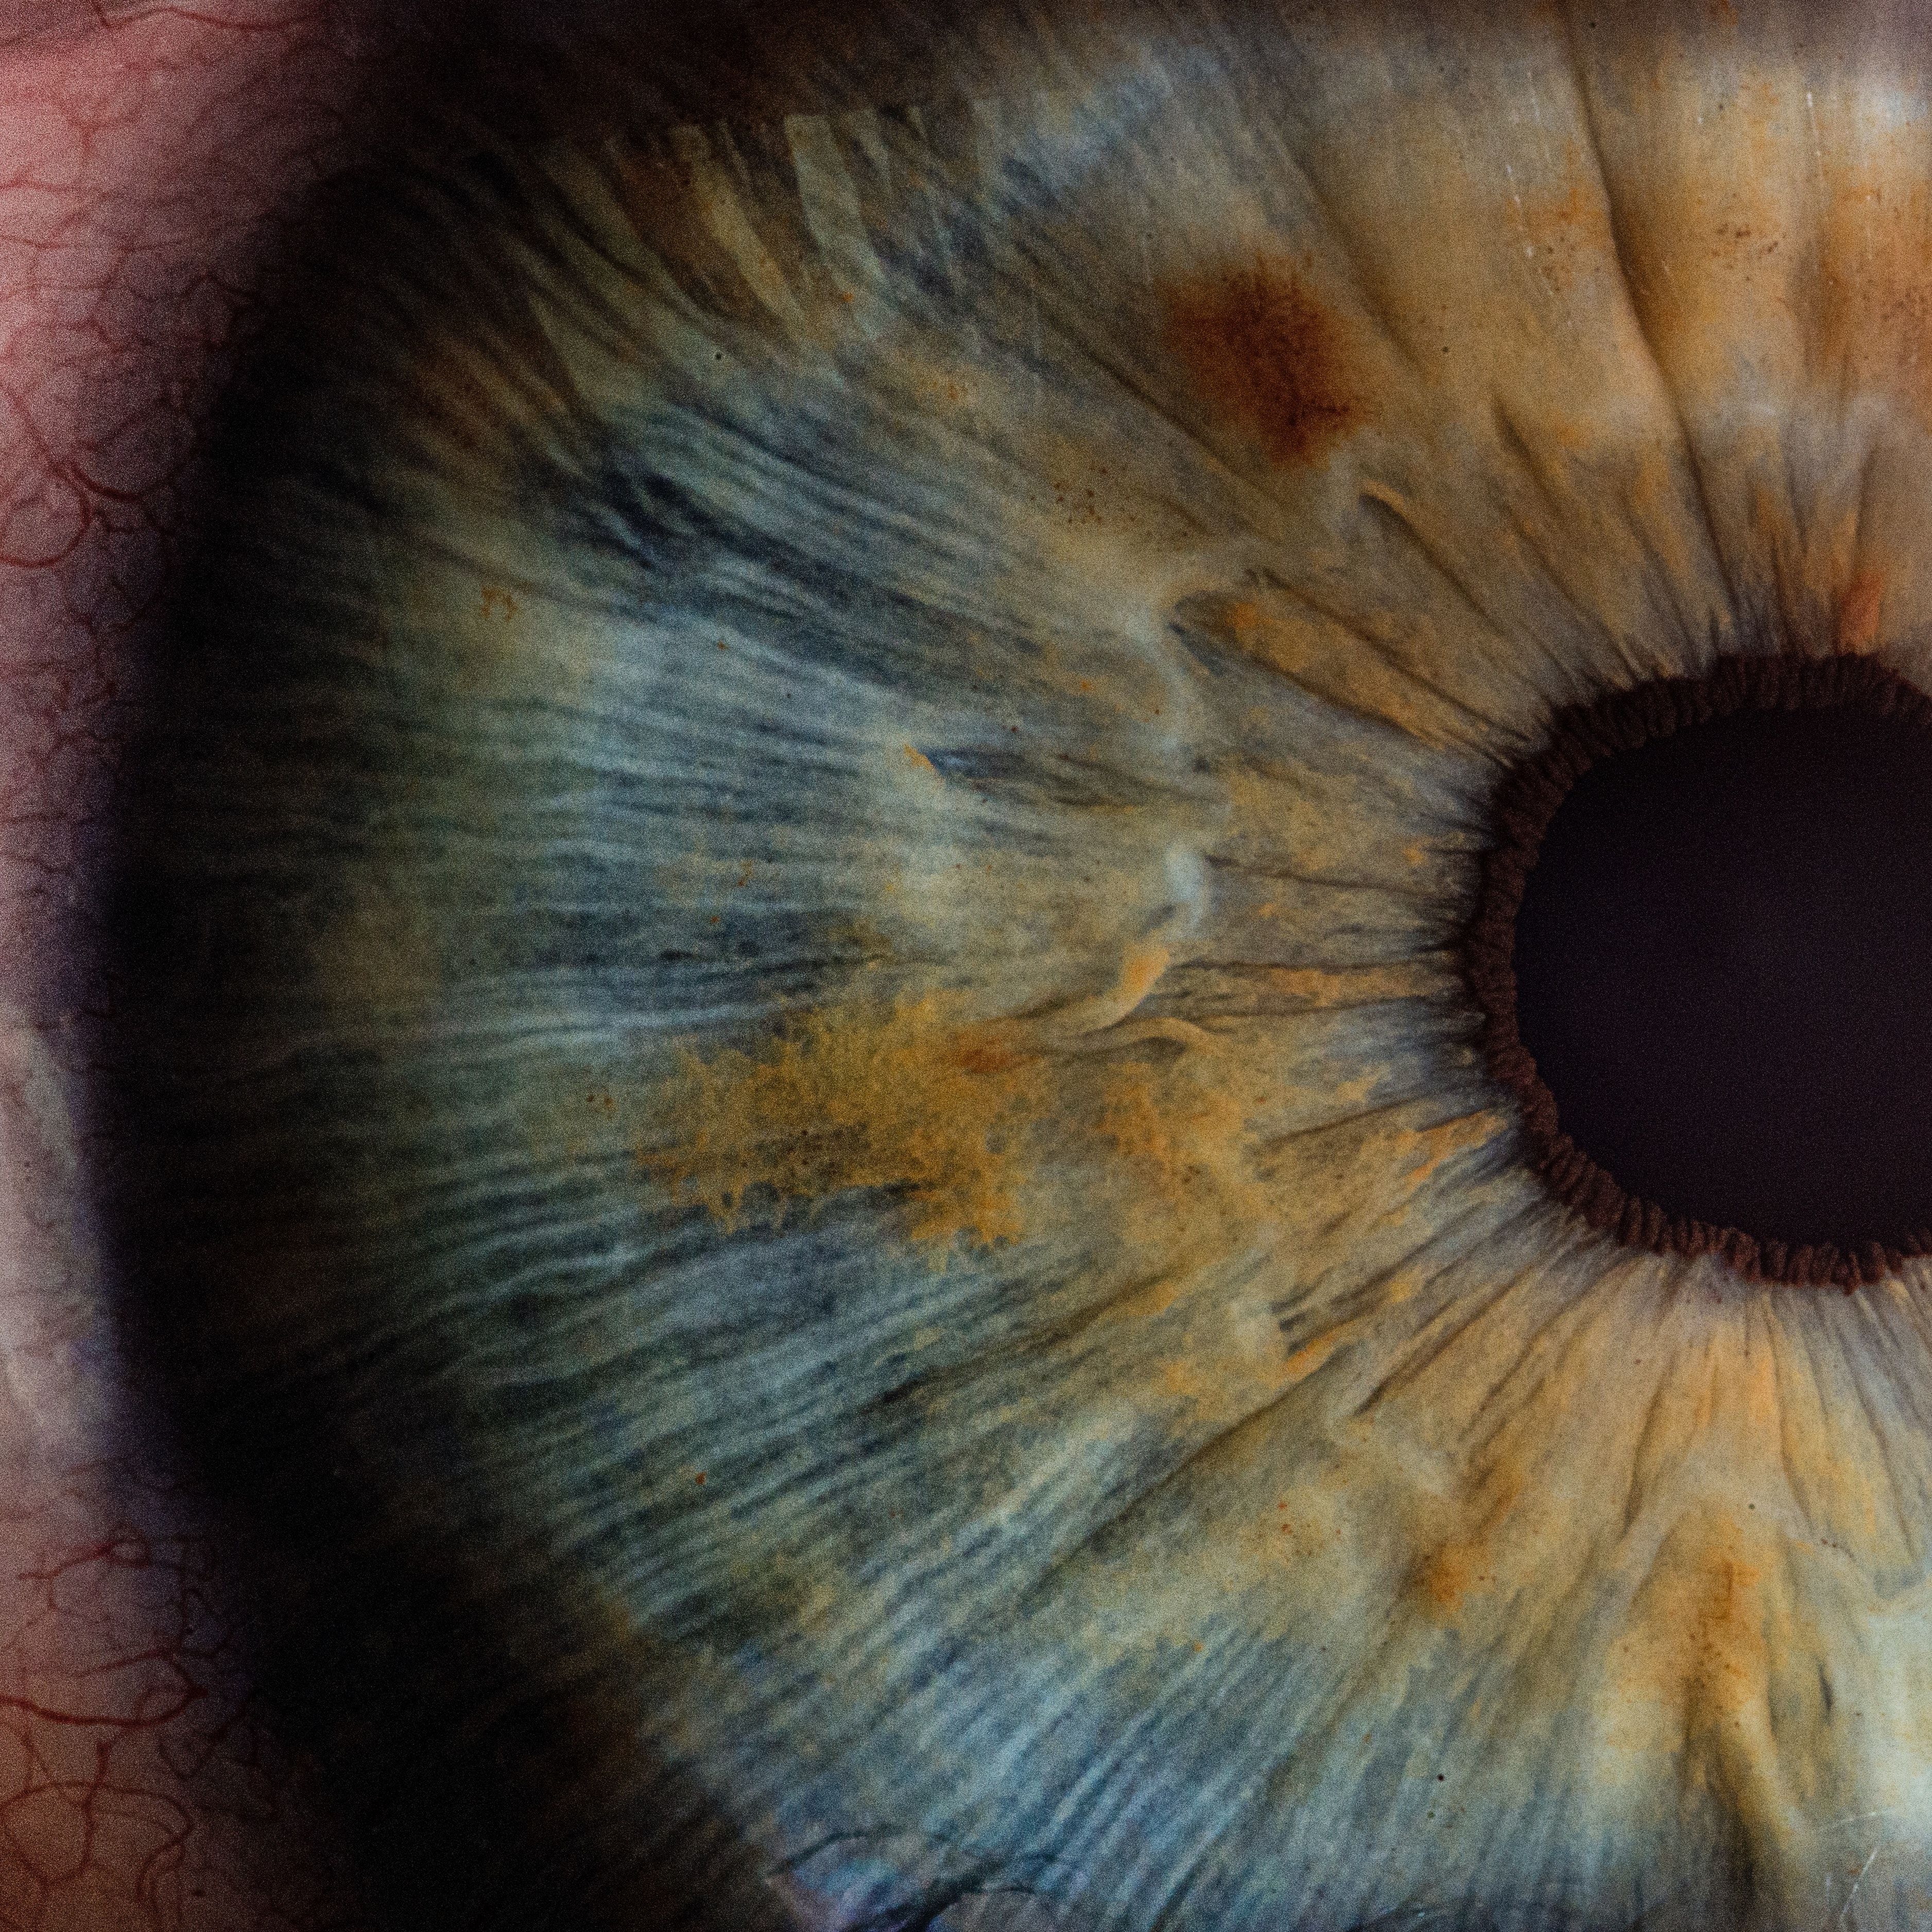
Many retinal diseases that can lead to blindness, including AMD, involve inadequate retinal oxygenation, so techniques that allow clinicians to determine retinal oxygenation — in any form – are important in assessing the retinal physiology of patients. The researchers, led by Anthony E. Felder (pictured), PhD, a clinical assistant professor in bioengineering at the University of Illinois at Chicago, explained that 3D imaging of the retinal tissue oxygen tension is “a promising tool for detecting lateral spatial variation in retinal tissue oxygen tension in animal models of retinal diseases.”
Other methods for measuring retinal oxygenation exist including spectrophotometry, phosphorescence lifetime imaging, and photoacoustic ophthalmoscopy, “however, these techniques can only provide an indirect assessment retinal tissue oxygenation from measurements of vascular oxygen content,” the authors noted.
The gold-standard method of measuring is with oxygen-sensitive microelectrodes, which measure the retinal tPO2 through the retinal depth. Although oxygen-sensitive microelectrodes provide an accurate measurement, the process is invasive and offer a limited spatial assessment of tPO2. By obtaining 3D images, the researchers in the current study aimed to both overcome such spatial limitations and learn more about variations in tPO2.
In authors described their imaging system a slitlamp biomicroscope that was modified to accommodate a 535-nm laser, along with an optical chopper, rotational galvanometer with an attached mirror, high-pass filter with 650-nm cutoff, and “an intensified charge-coupled device (ICCD) camera.”
Nine rats were divided into 2 groups for the study: the normoxia group (n=6), which was ventilated mechanically with either 21%/30% fraction of inspired oxygen (FiO2), and the hypoxia group (n=3), which was ventilated mechanically with 10% FiO2. One rat in the normoxia group was also ventilated under hypoxia to allow comparison to the retinal tPO2.
“The laser line was horizontally scanned across the retina, and phosphorescence emission was selectively imaged at each location using the high-pass filter placed in front of the ICCD camera,” the authors wrote. They set incremental delays in order to obtain 6-10 scans at each retinal location. After obtaining scans from all of the rats, the data was compiled and the mean tPO2 (MtPO2) determined.
“At each retinal depth, MtPO2 was lower under hypoxia than under normoxia,” the researchers noted, adding that under both of the system’s conditions, the MtPO2 increased along with retinal depth, “indicating lower tPO2 in the inner retina and higher tPO2 toward the chorioretinal interface.” These were the expected results, but due to scatter of phosphorescence in the retinal tissue, they were unable to see retinal vessels.
There were some limitations to this study. For example, the animals had to be light-adapted, intraretinal phosphorescence scattering could have reduced the depth resolution and therefore changed the tPO2 depth profiles, and eye motion that occurred during the imaging from respiration could have caused some blurring, among other limitations.
The full study can be found in the journal Current Eye Research.